Note
Go to the end to download the full example code.
Truss Element Responses
import openseespy.opensees as ops

import opstool as opst
import opstool.vis.pyvista as opsvis
opst.load_ops_examples("TrussBridge")  # or your model code here

# add loads
ops.timeSeries("Linear", 1)
ops.pattern("Plain", 1, 1)
ops.load(3, 0.0, 0.0, -15000.0)
ops.load(4, 0.0, 0.0, -15000.0)
ops.load(5, 0.0, 0.0, -15000.0)
ops.load(6, 0.0, 0.0, -15000.0)
ops.load(7, 0.0, 0.0, -15000.0)
ops.load(8, 0.0, 0.0, -15000.0)
ops.load(17, 0.0, 0.0, -15000.0)
ops.load(18, 0.0, 0.0, -15000.0)
ops.load(19, 0.0, 0.0, -15000.0)
ops.load(20, 0.0, 0.0, -15000.0)
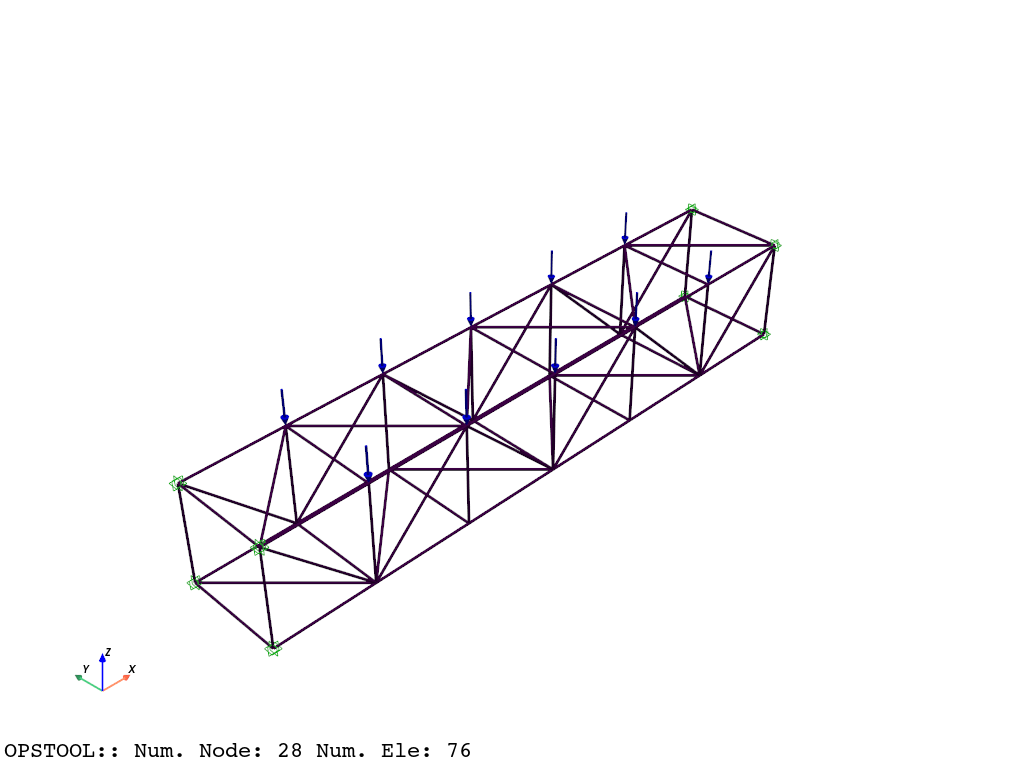
opsvis.set_plot_props(point_size=0, line_width=3)

fig = opsvis.plot_model(show_nodal_loads=True, show_ele_loads=True)
fig.show()
Widget(value='<iframe src="http://localhost:61479/index.html?ui=P_0x1da8f7bf6b0_0&reconnect=auto" class="pyvista" style="width: 99%; height: 600px; border: 1px solid rgb(221,221,221);"></iframe>')
Start of analysis generation create SOE
Nsteps = 10
ops.system("ProfileSPD")
# create DOF number
ops.numberer("Plain")
# create constraint handler
ops.constraints("Plain")
# create integrator
ops.integrator("LoadControl", 1.0 / Nsteps)
# create algorithm
ops.algorithm("Newton")
# create test
ops.test("NormUnbalance", 1e-8, 10)
# create analysis object
ops.analysis("Static")
ODB = opst.post.CreateODB(odb_tag=1)
for i in range(Nsteps):
    ops.analyze(1)
    ODB.fetch_response_step()
ODB.save_response()
OPSTOOL :: All responses data with _odb_tag = 1 saved in G:\opstool\docs\.opstool.output/RespStepData-1.zarr!
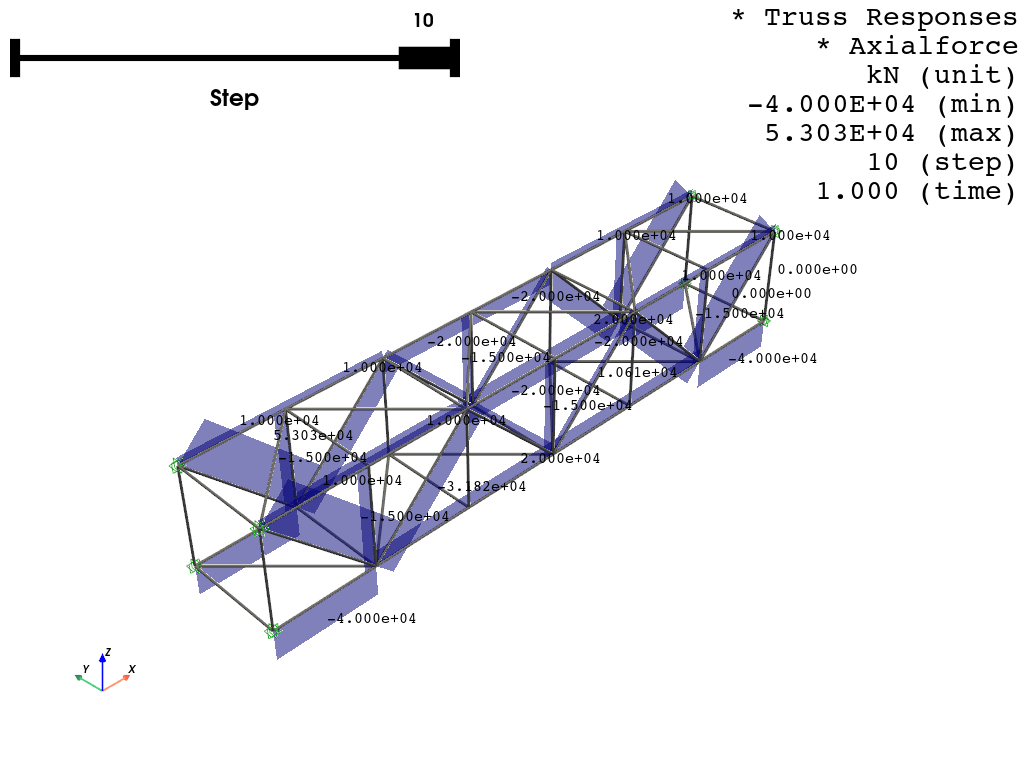
opsvis.set_plot_props(point_size=0, line_width=3)
opsvis.set_plot_colors(truss="gray", cmap="coolwarm")

fig = opsvis.plot_truss_responses(
    odb_tag=1,
    resp_type="axialForce",
    unit_symbol="kN",
    slides=True,
    alpha=1.0,
    style="surface",  # "wireframe", "surface"
    color="blue",
    opacity=0.5,  # opacity for "surface" style
    show_values=True,
)
fig.show()
OPSTOOL ::  Loading response data from G:\opstool\docs\.opstool.output/RespStepData-1.zarr ...
Widget(value='<iframe src="http://localhost:61479/index.html?ui=P_0x1da8f860c50_0&reconnect=auto" class="pyvista" style="width: 99%; height: 600px; border: 1px solid rgb(221,221,221);"></iframe>')
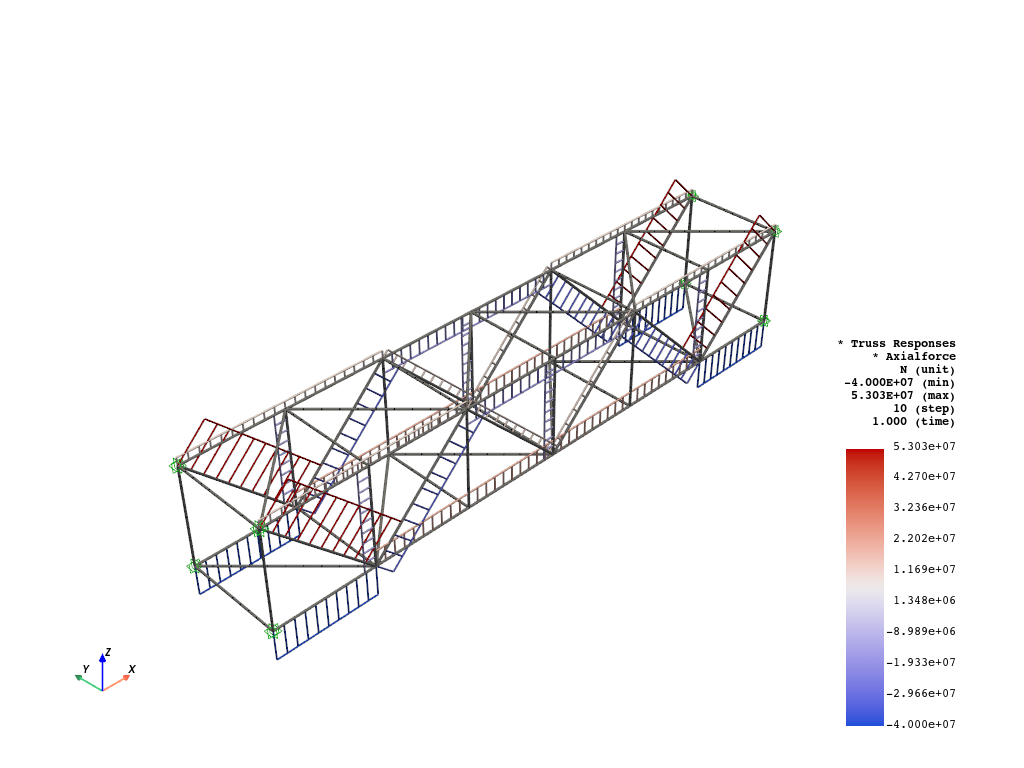
fig = opsvis.plot_truss_responses(
    odb_tag=1,
    resp_type="axialForce",
    unit_symbol="N",
    unit_factor=1000,
    slides=False,
    step="absMax",
    alpha=1.0,
    style="wireframe",  # "wireframe", "surface"
    line_width=2,  # line width for wireframe
    show_values=False,
)
fig.show()
OPSTOOL ::  Loading response data from G:\opstool\docs\.opstool.output/RespStepData-1.zarr ...
Widget(value='<iframe src="http://localhost:61479/index.html?ui=P_0x1da8f893710_0&reconnect=auto" class="pyvista" style="width: 99%; height: 600px; border: 1px solid rgb(221,221,221);"></iframe>')
fig = opsvis.plot_truss_responses_animation(
    odb_tag=1,
    resp_type="axialForce",
    unit_symbol="kN",
    savefig="images/TrussRespAnimation.gif",
    framerate=2,
    alpha=1.0,
    style="wireframe",  # "wireframe", "surface"
    color="blue",
    show_values=False,
)
fig.close()
OPSTOOL ::  Loading response data from G:\opstool\docs\.opstool.output/RespStepData-1.zarr ...
Animation has been saved as images/TrussRespAnimation.gif!
Total running time of the script: (0 minutes 3.129 seconds)